Tag: Modeling

Online Virus Tracking Tool Nextstrain Wins Inaugural Open Science Prize

0 comments
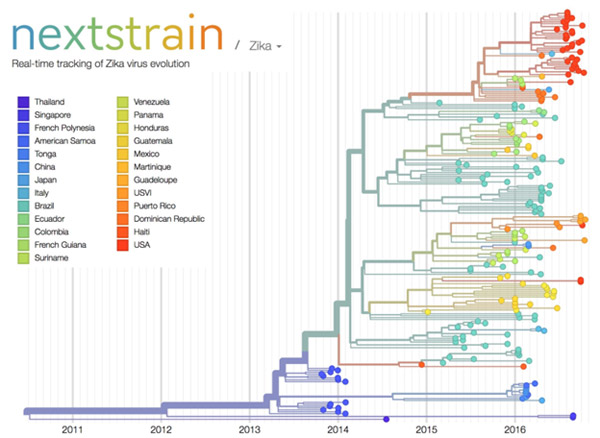
Nextstrain’s analysis of the genomes from Zika virus obtained in 25 countries over the past few years. 
Credit: Trevor Bedford and Richard Neher, nextstrain.org.

Over the past decade, scientists and clinicians have eagerly deposited their burgeoning biomedical data into publicly accessible databases. However, a lack of computational tools for sharing and synthesizing the data has prevented this wealth of information from being fully utilized.

In an attempt to unleash the power of open-access data, the National Institutes of Health, in collaboration with the Howard Hughes Medical Institute and Britain’s Wellcome Trust, launched the Open Science Prize. Last week, after a multi-stage public voting process, the inaugural award was announced. The winner of the grand prize—and $230,000—is a prototype computational tool called nextstrain Exit icon that tracks the spread of emerging viruses such as Ebola and Zika. This tool could be especially valuable in revealing the transmission patterns and geographic spread of new outbreaks before vaccines are available, such as during the 2013-2016 Ebola epidemic and the current Zika epidemic.

An international team of scientists—led by NIGMS grantee Trevor Bedford of the Fred Hutchinson Cancer Research Center, Seattle, and Richard Neher Exit icon of Biozentrum at the University of Basel, Switzerland—developed nextstrain as an open-access system capable of sharing and analyzing viral genomes. The system mines viral genome sequence data that researchers have made publicly available online. nextstrain then rapidly determines the evolutionary relationships among all the viruses in its database and displays the results of its analyses on an interactive public website.

The image here shows nextstrain’s analysis of the genomes from Zika virus obtained in 25 countries over the past few years. Plotting the relatedness of these viral strains on a timeline provides investigators a sense of how the virus has spread and evolved, and which strains are genetically similar. Researchers can upload genome sequences of newly discovered viral strains—in this case Zika—and find out in short order how their new strain relates to previously discovered strains, which could potentially impact treatment decisions.

Nearly 100 interdisciplinary teams comprising 450 innovators from 45 nations competed for the Open Science Prize. More than 3,500 people from six continents voted online for the winner. Other finalists for the prize focused on brain maps, gene discovery, air-quality monitoring, neuroimaging and drug discovery.

nextstrain was funded in part by NIH under grant U54GM111274.

Forecasting Infectious Disease Spread with Web Data

0 comments

Just as you might turn to Twitter or Facebook for a pulse on what’s happening around you, researchers involved in an infectious disease computational modeling project are turning to anonymized social media and other publicly available Web data to improve their ability to forecast emerging outbreaks and develop tools that can help health officials as they respond.

Mining Wikipedia Data

Screen shot of the Wikipedia site
Incorporating real-time, anonymized data from Wikipedia and other novel sources of information is aiding efforts to forecast and respond to emerging outbreaks. Credit: Stock image.

“When it comes to infectious disease forecasting, getting ahead of the curve is problematic because data from official public health sources is retrospective,” says Irene Eckstrand of the National Institutes of Health, which funds the project, called Models of Infectious Disease Agent Study (MIDAS). “Incorporating real-time, anonymized data from social media and other Web sources into disease modeling tools may be helpful, but it also presents challenges.”

To help evaluate the Web’s potential for improving infectious disease forecasting efforts, MIDAS researcher Sara Del Valle of Los Alamos National Laboratory conducted proof-of-concept experiments involving data that Wikipedia releases hourly to any interested party. Del Valle’s research group built models based on the page view histories of disease-related Wikipedia pages in seven languages. The scientists tested the new models against their other models, which rely on official health data reported from countries using those languages. By comparing the outcomes of the different modeling approaches, the Los Alamos team concluded that the Wikipedia-based modeling results for flu and dengue fever performed better than those for other diseases. Continue reading “Forecasting Infectious Disease Spread with Web Data”

Field Focus: Asking Our Expert About Modeling Ebola

0 comments
Irene Eckstrand
NIGMS’ Irene Eckstrand answers questions about modeling Ebola. Credit: National Institute of General Medical Sciences.

Ebola is the focus of many NIH-supported research efforts, from analyzing the genetics of virus samples to evaluating the safety and effectiveness of treatments and vaccines. Researchers involved in our Models of Infectious Disease Agent Study, or MIDAS, have been using computational methods to forecast the potential course of the outbreak and the impact of various intervention strategies.

Wondering how their work is going, I recently asked our modeling expert Irene Eckstrand a few questions.

How useful are the forecasts?

Forecasts give us a range of possible outcomes. In addition to being a useful public health tool to prepare for an outbreak, they’re an important research tool to test assumptions about how a disease may spread. When we compare the predicted and actual outcomes, we can confirm assumptions, such as the groups of individuals who are more likely to spread the infection to others. Continually doing this helps refine the models and ensure that their forecasts are as accurate as possible.

What are some of the challenges the modelers face?

Ebola virus
Ebola virus particles (green) attached to and budding from a cell (blue). Credit: National Institute of Allergy and Infectious Diseases.

We need data to build and test models. The data available from this outbreak have been more limited than in most previous outbreaks of Ebola simply because the public health systems are overwhelmed with sick people, and recording information is a secondary priority.

Another issue with forecasting future trends is incorporating information about the deployment of resources and the implementation of interventions that actually slowed the outbreak. We also need to incorporate changes in people’s behavior. If people think an outbreak is leveling off, they may relax the precautions they’ve been taking—and that could lead to another spike in the disease.

What other Ebola-related projects are the MIDAS modelers working on?

The MIDAS researchers are:

  • Modeling logistical factors such as the number and placement of treatment beds and staffing needs.
  • Tracking potential transmission within and between communities and at hospitals and funerals.
  • Developing a method to estimate the amount of underreporting of case data.
  • Applying models of “tipping points” to look for evidence that the disease curve is slowing.
  • Estimating the number of people who are infected but not symptomatic.
  • Creating new resources for Ebola modelers, including standards for using infectious disease data.
  • Calculating the risk of importation of cases for a wide variety of countries based on travel networks.

How are the modelers working together?

The MIDAS modelers conference call 1-2 times a week to discuss results, modeling strategies, data sources and questions amenable to modeling. They also participate in discussions with government and other academic groups, so there’s a sizable number of modelers working on a wide variety of public health, logistical and basic research questions.

If you’re interested in learning more about Ebola, Irene recommends a video overview of the 2014 outbreak from Penn State University Exit icon and a slide presentation on the myths and realities of the disease from Nigeria’s Kaduna State University Exit icon.

Meet Janet Iwasa

0 comments
Janet Iwasa
Credit: Janet Iwasa
Janet Iwasa
Fields: Cell biology and molecular animation
Works at: University of Utah
Raised in: Indiana and Maryland
Studied at: University of California, San Francisco, and Harvard Medical School
When not in the lab she’s: Keeping up with her two preschool-aged sons
Something she’s proud of that she’ll never try again: Baking a multi-tiered wedding cake, complete with sugar flowers, for a friend’s wedding.

Janet Iwasa wouldn’t have described herself as an artistic child. She didn’t carry around a sketch pad, pencils or paintbrushes. But she remembers accompanying her father, a scientist at the National Institutes of Health, to his lab on the weekends. She’d spend hours doodling in a drawing program on his old Macintosh computer while he worked on experiments.

“I always remember wanting to be a scientist, and that’s probably highly inspired by my dad,” says Iwasa. Her early affinity for art and technology set her on an unusual career path to become a molecular animator. A typical work day now finds her adapting computer programs originally designed to bring characters like Buzz Lightyear to life to help researchers probe complicated, dynamic interactions within cells.

Iwasa’s interest in animation was sparked when she was a graduate student in cell biology, studying a protein called actin, which helps cells to move and change shape. At the time, the only visual representations she had of actin networks were flat, two-dimensional drawings on paper. When she saw an animation of the dynamic movement of a molecule called kinesin, she thought, “Why are we relying on oversimplified, static illustrations [of molecules], when we can be doing something like this video?”

Within a year, she was taking an animation class at a local college. She quickly realized that she would need more intensive instruction to be able to animate complex biological processes. A few summers later, she flew to Hollywood for a 3-month training program in industry-standard animation technology.

The oldest student in that course—and the only woman—Iwasa immediately began thinking about how to adapt a standard animator’s toolkit to illustrate the inner life of cells. A technique used to create the effect of human hair blowing in the wind could also show the movement of an RNA molecule. A chunk of computer code used to make the facets of a soccer ball fall apart and come back together in a different order could be adapted to model virus assembly and disassembly.

Her Findings

Following her training, Iwasa spent 2 years as a National Science Foundation Discovery Corps fellow, producing the Exploring Life’s Origins exhibit with the Boston Museum of Science and the Szostak Lab at Massachusetts General Hospital/Harvard Medical School. As part of the multi-media exhibit, she created animations to illustrate how the simplest living organisms may have evolved on early Earth.

Since then, Iwasa has helped researchers model such complex actions as how cells ingest materials, how proteins are transported across a cell membrane, and how the motor protein dynein helps cells divide.

Screenshot from the video that shows how a protein called clathrin forms a cage-like container that cells use to engulf and ingest materials
Iwasa developed this video to show how a protein called clathrin forms a cage-like container that cells use to engulf and ingest materials.

Iwasa calls her animations “visual hypotheses”: The end results may be beautiful, but the process of animation itself is what encapsulates, clarifies and communicates the science.

“It’s really building the animated model that brings insights,” she says. “When you’re creating an animation, you’re really grappling with a lot of issues that don’t necessarily come up by any other means. In some cases, it might raise more questions, and make people go back and do some more experiments when they realize there might be something missing” in their theory of how a molecular process works.

Now she’s working with an NIH-funded research team at the University of Utah to develop a detailed animation of how HIV enters and exits human immune cells.

Abbreviated CHEETAH, the full name of the group is the Center for the Structural Biology of Cellular Host Elements in Egress, Trafficking, and Assembly of HIV.

“In the HIV life cycle, there are a number of events that aren’t really well understood, and people have different ideas of how things happen,” says Iwasa. She plans to animate the stages of viral infection in ways that reflect different proposals for how the process works, to give researchers a new way to visualize, communicate—and potentially harmonize—their hypotheses.

The full set of Iwasa’s HIV-related animations will be available online as they are completed, at https://scienceofhiv.org, with the first set launching in the fall of 2014.

Learn more:
Janet Iwasa’s TED Talk: How animations can help scientists test a hypothesis
Janet Iwasa’s 3D model of an HIV particle was a winner in the 2014 BioArt contest sponsored by Federation of American Societies for Experimental Biology
NIH Director’s blog post about Iwasa and her HIV video animation
Meet Jeff Shaman

0 comments
Jeff Shaman
Jeff Shaman
Field: Climatology
Works at: Columbia University’s Mailman School of Public Health, N.Y.
Favorite high school subject: Biology
First job: Guide at the Franklin Institute in Philadelphia, Pa.
Alternative career: Opera singer
Credit: Anne Foulke

Before he wrote any scientific papers, Jeff Shaman wrote operas. At the premiere of one of his operas, an 80-minute story about psychoanalysis, reviewers said the work “crackle[d] with invention.”

After 4 years of training to become an opera singer, Shaman realized that the work wouldn’t offer him career stability. He started thinking about his other interests. After college, where he majored in biology with a focus on ecology, he had volunteered to help with HIV clinical trials and developed a fascination with understanding infectious diseases. He wondered if the quantitative tools and methods used to study the physical sciences—another interest area—could inform how contagions spread and possibly even lead to systems for monitoring or predicting their transmission.

So Shaman returned to school—this time, for advanced degrees in earth and environmental sciences. He now studies the relationship between soil wetness and mosquito-borne diseases such as malaria in Africa and West Nile in Florida.

“I love science—probing questions, thinking about problems, finding solutions, pursuing my ideas,” says Shaman.

His Findings

A few years ago, Shaman took some of his scientific compositions in another direction by focusing on seasonal flu outbreaks. For more than 60 years, researchers have linked seasonal flu outbreaks with environmental data like humidity and temperature. Shaman analyzed this work and figured out that absolute humidity, rather than relative humidity, was the best predictor of outbreaks. Now he’s applied state-of-the-art mathematical modeling and real-time observational estimates of influenza incidence to predict when outbreaks will likely occur.

His forecasting technique mimics that used by meteorologists to predict weather conditions like temperatures, precipitation and even hurricane landfall. Shaman’s version incorporates variables like how transmissible a virus is, the number of days people are contagious and sick, and how much humidity is in the air.

The flu forecasts build on a series of studies in which Shaman and his colleagues used data from previous influenza seasons to test their predictions and improve reliability of their model. The work culminated with real-time predictions for 108 cities during the 2012-2013 influenza season. The forecasts could reliably estimate the peaks of flu outbreaks up to 9 weeks before they occurred.

For the 2013-2014 flu season, the researchers continued to make weekly predictions. But instead of first publishing the results in a scientific journal, they posted them on a newly launched influenza forecasts Web site  where the public could view the projections.

“People understand the limitations and capabilities of weather forecasts,” says Shaman. “Our hope is that people will develop a similar familiarity with the flu forecasts and use that information to make sensible decisions.” For instance, the prediction of high influenza activity may motivate them to get vaccinated and practice other flu-prevention measures.

As he waits for the start of the next flu season, Shaman continues to tweak his forecast system to improve its reliability. He’s also beginning to address other questions, such as how to predict multiple outbreaks of different influenza strains and how to predict the spread of other respiratory illnesses.

Learn more:
Influenza Forecasts Web Site 

Local Flu Forecasts Posted on New Web Site

0 comments
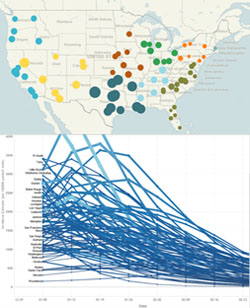
Incidence of influenza during the week starting 12/29/2013 (top); influenza incidence forecasts for selected cities (bottom). Credit: Columbia Prediction of Infectious Diseases.

News articles this weekend reported an uptick in flu cases in many parts of the country. When will your area be hardest hit? Infectious disease experts at Columbia University have launched an influenza forecast Web site that gives weekly predictions for rates of flu infection in 94 U.S. cities. The predictions indicate the number of cases in Chicago; Atlanta; Washington, D.C.; and Los Angeles will peak this week, with New York City, Boston, Miami and Providence peaking in following weeks. The forecasts are updated every Friday afternoon, so check back then for any changes.

The forecasting approach, which adapts techniques used in modern weather prediction, relies on real-time observational data of people with influenza-like illness, including those who actually tested positive for flu. The researchers have spent the last couple of years developing the forecasting system and testing it—first retrospectively predicting flu cases from 2003-2008 in New York City and then in real time during the 2012-2013 influenza season in 108 cities.

“People have become acclimated to understanding the capabilities and limitations of weather forecasts,” said Jeffrey Shaman, who’s led the flu forecasting project. “Making our forecasts available on the Web site will help people develop a similar familiarity and comfort.” Shaman and his team are hoping that, just as rainy forecasts prompt more people to carry umbrellas, an outlook for high influenza activity may motivate them to get vaccinated and practice other flu-prevention measures.

This work also was funded by NIH’s National Institute of Environmental Health Sciences.

Learn more:

Columbia University News Release

New Models Predict Where E. coli Strains Will Thrive

0 comments
Illustration of E. coli. Credit: Janet Iwasa, University of Utah.
Illustration of E. coli. Credit: Janet Iwasa, University of Utah (image available under a Creative Commons Attribution-NonCommercial-ShareAlike license Exit icon). View larger image

Like plants and animals, different types of E. coli thrive in different environments. Now, scientists can even predict which environments—such as the bladder, stomach or blood—are most amenable to the growth of various strains, including pathogenic ones. A research team led by Bernhard Palsson Exit icon of the University of California, San Diego, accomplished this by using genome data to reconstruct the metabolic networks of 55 E. coli strains. The metabolic models, which identify differences in the ability to manufacture certain compounds and break down various nutrients, shed light on how certain E. coli strains become pathogenic and how to potentially control them. One approach could be depriving the deadly strains of the nutrients they need to survive in their niches. The researchers plan to use their new method to study other bacteria, such as those that cause staph infections.

This work also was funded by NIH’s National Cancer Institute.

Learn more:
University of California, San Diego News Release